Resource Spotlight: Which local governments engage in or avoid prison gerrymandering?
We’ve identified over 200 cities and counties that have taken action to avoid prison gerrymandering and some local governments that still continue to base representation on flawed Census Bureau data.
by Aleks Kajstura, September 24, 2024
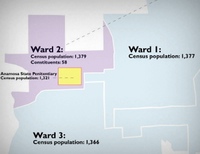
The movement to end prison gerrymandering started with local governments. Because of their relatively small size, city and county governments often experience the most distortive impacts of the problem. When drawing districts in these communities, a single prison can easily account for an entire city council or county commission district. This not only makes it impossible for officials to draw fair districts, but it also gives some residents as much as five times1 the political clout of other residents of the community.
Prison gerrymandering is a problem created because the Census Bureau incorrectly counts incarcerated people as residents of their prison cells rather than their home communities. As a result, when states and local governments use Census data to draw new political boundaries, they inadvertently give residents of districts with prisons greater political clout than all other residents.
It can be incredibly difficult to know whether a local government has ended prison gerrymandering, but we’ve done much of that legwork for you. We have two pages covering our prison gerrymandering research on local governments — spanning three decades:
- The first lists local governments that avoid prison gerrymandering and
- The other lists those that still engage in prison gerrymandering.
Building these lists takes painstaking research. Very few states have centralized records of local redistricting maps, so we reached out to nearly every city, county, and other local government on those lists to figure out whether they ended prison gerrymandering. We gather the maps, analyze the population data, sift through council meeting notes, and interview local officials to come to our conclusions. Sometimes, regional or state organizations do similar research to supplement our efforts, or individuals working in or living in these areas will add their findings to the collection.
There are two important notes about these lists:
- As you can guess, it’s impossible to do this research for all of the nearly 40,000 town, city, and county governments in the US. So, we focus on those that are most likely to yield significant or interesting results. As a result, both of these lists are almost certainly undercounts of the places that do — or don’t — engage in prison gerrymandering.
- Many states that have passed prison gerrymandering reform laws also cover local governments under those measures. To make the best use of our time and resources, we didn’t research to confirm whether cities or count in those states ended prison gerrymandering, so they don’t appear on these lists.
Because of these two factors, these lists shouldn’t be considered comprehensive or used for any conclusive comparison between decades. These lists are only a partial reflection of the general decline in the number of local governments engaging in prison gerrymandering, and the general increase in local governments avoiding prison gerrymandering, and don’t show the full story of prison-hosting communities increasingly rejecting prison gerrymandering.
We also encourage you to check out our Pathfinder tool, for more information on the issue, including dozens of state-by-state and district-by-district reports, hundreds of articles and fact sheets, and more spread across our website (and even some notable resources from other organizations, too).
These resources provide important information and context about prison gerrymandering for local officials, journalists, and advocates. It can help to show the scale of the problem in their communities, as well as put a spotlight on those places that have taken on the task of solving this problem.
Footnotes
-
For example, Juneau County, WI contains one of the most prison gerrymandered county commission districts in the nation, where incarcerated people account for roughly 83% of the district’s population. As a result, 17 actual residents of this district have as much political clout as 100 residents of any other district in the county. ↩


