Another decade of prison gerrymandering in Ohio
New fact sheet highlights prison gerrymandering in Ohio after the 2010 Census.
by Aleks Kajstura,
October 3, 2013
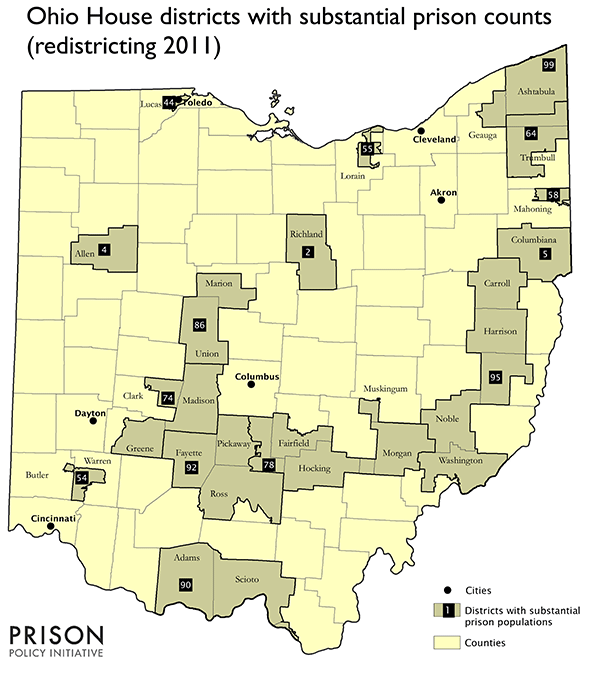
We have a new fact sheet highlighting the problem of prison gerrymandering in Ohio after the 2010 Census. The Census Bureau’s practice of counting incarcerated people as if they are residents of the prison, rather than their home address, continues to have a major impact on voting equality in Ohio, where there are 15 state House districts and 8 Senate districts padded with significant incarcerated populations.
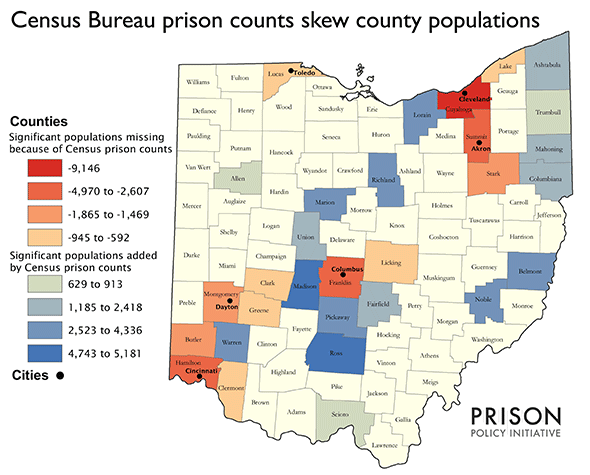
The map below shows how the Census Bureau’s prison count moves incarcerataed people across county lines (for more detail, see the table at the end of this post):

This skewed population data has a significant impact on legislative districts. After redistricting in 2011, each House District in Ohio was supposed to have about the same number of people, but some districts were credited with as many as 9,000 incarcerated people from other parts of the state. This gives voters in those districts extra influence and dilutes the weight of votes cast in districts that weren’t padded with prison populations. For example, District 92 (Fayette, Ross, and Pickaway Counties) was credited with 9,045 incarcerated people and District 86 (Union and Madison Counties) was padded with 7,189 incarcerated people.

The effects of prison gerrymandering are even starker in cities that host correctional facilities. For example, 74% of a ward in the city of Marion is incarcerated, giving the residents of this ward four times the voting power of other city residents. The city of Lima, however, joined over 200 local governments across the country and avoided prison gerrymandering by refusing to pad the City Council wards with the Census’ prison count. So far Lima is the only city in Ohio that has adjusted the redistricting population to reflect actual town residents, but the city of Youngstown, now in the midst of redistricting, may yet follow Lima’s lead.
The Census Bureau’s prison count impact on county populations
| County |
Number of people in state prison from that county |
Number of people incarcerated in state or federal prison in the county |
Net change in county population because Census Bureau counts incarcerated people as residents of the prison location |
| Adams |
131 |
0 |
-131 |
| Allen |
530 |
1,443 |
913 |
| Ashland |
148 |
0 |
-148 |
| Ashtabula |
315 |
1,500 |
1,185 |
| Athens |
291 |
0 |
-291 |
| Auglaize |
212 |
0 |
-212 |
| Belmont |
137 |
2,692 |
2,555 |
| Brown |
265 |
0 |
-265 |
| Butler |
1,469 |
0 |
-1,469 |
| Carroll |
45 |
0 |
-45 |
| Champaign |
227 |
0 |
-227 |
| Clark |
876 |
0 |
-876 |
| Clermont |
741 |
0 |
-741 |
| Clinton |
191 |
0 |
-191 |
| Columbiana |
237 |
2,473 |
2,236 |
| Coshocton |
132 |
0 |
-132 |
| Crawford |
131 |
0 |
-131 |
| Cuyahoga |
9,391 |
245 |
-9,146 |
| Darke |
92 |
0 |
-92 |
| Defiance |
254 |
0 |
-254 |
| Delaware |
330 |
0 |
-330 |
| Erie |
403 |
0 |
-403 |
| Fairfield |
294 |
1,540 |
1,246 |
| Fayette |
196 |
0 |
-196 |
| Franklin |
5,109 |
596 |
-4,513 |
| Fulton |
79 |
0 |
-79 |
| Gallia |
127 |
0 |
-127 |
| Geauga |
99 |
0 |
-99 |
| Greene |
592 |
0 |
-592 |
| Guernsey |
167 |
0 |
-167 |
| Hamilton |
4,970 |
0 |
-4,970 |
| Hancock |
277 |
0 |
-277 |
| Hardin |
124 |
0 |
-124 |
| Harrison |
33 |
0 |
-33 |
| Henry |
85 |
0 |
-85 |
| Highland |
235 |
0 |
-235 |
| Hocking |
127 |
485 |
358 |
| Holmes |
57 |
0 |
-57 |
| Huron |
147 |
0 |
-147 |
| Jackson |
116 |
0 |
-116 |
| Jefferson |
272 |
0 |
-272 |
| Knox |
140 |
0 |
-140 |
| Lake |
735 |
0 |
-735 |
| Lawrence |
322 |
0 |
-322 |
| Licking |
751 |
0 |
-751 |
| Logan |
145 |
0 |
-145 |
| Lorain |
1,029 |
3,929 |
2,900 |
| Lucas |
2,117 |
1,172 |
-945 |
| Madison |
113 |
4,856 |
4,743 |
| Mahoning |
1,002 |
2,612 |
1,610 |
| Marion |
415 |
4,594 |
4,179 |
| Medina |
372 |
0 |
-372 |
| Meigs |
127 |
0 |
-127 |
| Mercer |
85 |
0 |
-85 |
| Miami |
316 |
0 |
-316 |
| Monroe |
36 |
0 |
-36 |
| Montgomery |
2,751 |
886 |
-1,865 |
| Morgan |
36 |
0 |
-36 |
| Morrow |
58 |
0 |
-58 |
| Muskingum |
401 |
0 |
-401 |
| Noble |
10 |
2,533 |
2,523 |
| Ottawa |
87 |
0 |
-87 |
| Paulding |
69 |
0 |
-69 |
| Perry |
98 |
0 |
-98 |
| Pickaway |
238 |
3,598 |
3,360 |
| Pike |
75 |
0 |
-75 |
| Portage |
343 |
0 |
-343 |
| Preble |
115 |
0 |
-115 |
| Putnam |
77 |
0 |
-77 |
| Richland |
715 |
5,051 |
4,336 |
| Ross |
266 |
5,447 |
5,181 |
| Sandusky |
180 |
0 |
-180 |
| Scioto |
782 |
1,411 |
629 |
| Seneca |
206 |
0 |
-206 |
| Shelby |
162 |
0 |
-162 |
| Stark |
1,751 |
0 |
-1,751 |
| Summit |
2,607 |
0 |
-2,607 |
| Trumbull |
632 |
1,351 |
719 |
| Tuscarawas |
160 |
0 |
-160 |
| Union |
177 |
2,595 |
2,418 |
| Van Wert |
78 |
0 |
-78 |
| Vinton |
51 |
0 |
-51 |
| Warren |
397 |
4,212 |
3,815 |
| Washington |
189 |
0 |
-189 |
| Wayne |
210 |
0 |
-210 |
| Williams |
177 |
0 |
-177 |
| Wood |
340 |
0 |
-340 |
| Wyandot |
82 |
0 |
-82 |


