Twenty one counties have twenty one percent of their population in prisons and jails
by Peter Wagner, April 19, 2004
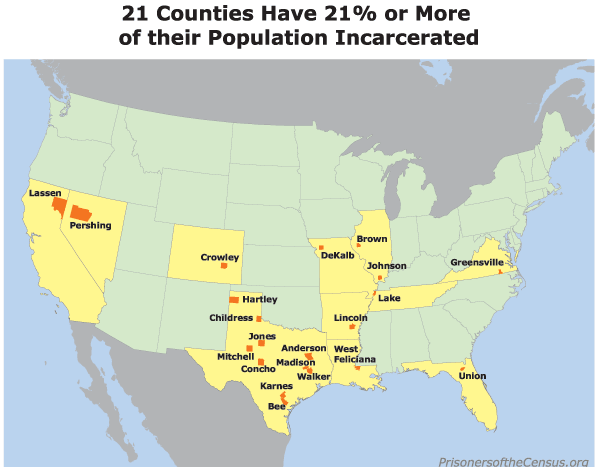
Counting large external populations of prisoners as local residents leads to misleading conclusions about the size and growth of communities. Many of the prison hosting counties have relatively small actual populations, but large prison populations. Twenty one counties in the United States have at least 21% of their population in prison. (See map and table.) In Crowley County, Colorado and West Feliciana Parish, Louisiana, one-third of the population consists of prisoners imported from somewhere else.
Many states keep and publish information on the significant counties of origin for their incarcerated population. Of the 4,061 prisoners incarcerated in Union County, Florida, only 52 were convicted there. We can’t provide similar data for Colorado, Louisiana, Texas, and Illinois because these states consider the counties in the table so insignificant that they aggregate them together as “other”.
In 21 counties, at least 21% of the population reported in the Census doesn’t exist in that county except in one important way: on the Census form.

| County | State | Census 2000 Population | Percent population incarcerated |
|---|---|---|---|
| Crowley | CO | 5,518 | 35% |
| West Feliciana | LA | 15,111 | 33% |
| Concho | TX | 3,966 | 33% |
| Union | FL | 13,442 | 30% |
| Brown | IL | 6,950 | 28% |
| Lake | TN | 7,954 | 27% |
| Mitchell | TX | 9,698 | 26% |
| Greensville | VA | 11,560 | 26% |
| Lassen | CA | 33,828 | 25% |
| Anderson | TX | 55,109 | 25% |
| Hartley | TX | 5,537 | 24% |
| DeKalb | MO | 11,597 | 23% |
| Jones | TX | 20,785 | 23% |
| Walker | TX | 61,758 | 23% |
| Childress | TX | 7,688 | 22% |
| Karnes | TX | 15,446 | 22% |
| Bee | TX | 32,359 | 22% |
| Lincoln | AR | 14,492 | 21% |
| Johnson | IL | 12,878 | 21% |
| Pershing | NV | 6,693 | 21% |
| Madison | TX | 12,940 | 21% |
Source: Rose Heyer and Peter Wagner, Too big to ignore: How counting people in prisons distorted Census 2000 and additional research by Rose Heyer and Peter Wagner. Union County conviction numbers are from 2002, the only data readily available. This article makes the conservative assumption that the none of the 52 Union County commitments are prisoners convicted of new offenses while incarcerated in the county. The true number of incarcerated Union County residents is likely to be smaller.


